Econometric Analysis of the Effects of the War in Ukraine and Black Sea Grain Initiative
An Econometric Analysis of the Russo-Ukrainian War, BSGI and Their Effects on Agricultural Commodities Exports
By: Joshua Gonzalez
jgonzalez@econpolicycenter.org
15 December 2023
Abstract:
This study examines the impact of the Russo-Ukrainian War and the Black Sea Grain Initiative (BSGI) on global and Ukrainian agricultural exports, using monthly averaged prices and quantities to mitigate the volatility found in daily data. The commodities analyzed in this paper include: wheat, corn, soybeans, rice, sunflower and rapeseed. The analysis, utilizing a Difference-in-Difference regression approach, reveals that the BSGI had a significant impact on global and Ukrainian-specific trade, providing additional food security in a time of severe geopolitical uncertainty. This paper finds the war significantly decreased global exports, particularly for Ukraine's primary exports like wheat, while the BSGI had mixed effects, aiding some commodities. The research underscores the BSGI's role in mitigating the war's adverse effects and suggests further study into the distributional impacts of these events on global agricultural markets.
1. Introduction
The February 2022 Russian Invasion of Ukraine came as a shock to global commodity markets and spectators alike, causing uncertainty and upheaval across the world. This act of aggression was not only against a neutral country, but a vital trade partner to many other nations across the world. Ukraine’s participation in global commodity markets, particularly grain and oilseed markets, meant that the war was sure to have some degree of welfare impact distributed across the globe. According to the Foreign Agricultural Service (FAS) Ukraine factsheet1, Ukraine is a vital supplier of global corn, wheat, sunflower, barely, rapeseed, and many other agricultural commodities, especially to developing nations across Asia and Africa alongside the EU.
The effect of the Russian invasion on Ukrainian and global experts caught the eyes of many governments and economists, being one of the most studied macroeconomic phenomena of 2022 and 2023. According to the Council of the European Union’s Ukrainian export and production numbers2, Ukrainian grain exports fell from a high of 4.3 million metric tonnes exported in September 2021 to a low of below 10,000 tonnes in April of 2022. The same Council estimated Ukraine’s lost production at 26% of its prewar levels, but not truly reflecting the difficulty of getting grain out of a war zone. This drastic effect on Ukrainian grain exports was immediately felt by the world markets through a mixture of market anxiety and constrained supply. Countries like India3 instituted grain export bans which further unnerved international markets and caused food security concerns for lower income countries relying on food imports to feed their populations4.
A dual response was initiated by importing stakeholders, primarily facilitated by the European Union and Turkey. The first part of the response was the opening of the European Union facilitated “Solidarity Lanes” which was a land-based approach to export Ukraine’s usually maritime exports of grain5. This was an over billion dollar infrastructure development project to increase pathway volume capacity out of Ukraine through their shared land border with the European Union and usage of European Union Danube ports starting in May of 2022. This initiative was responsible for between 2.5 and 5 billion tonnes of grain exported per month, 60% of total exports since the start of the war, according to the European Commission’s own numbers.
In between the infrastructure development of Ukraine’s EU land borders and expansion of Danube port capacity, Turkey subsequently facilitated a stop-gap measure to allow Ukrainian grain to reach international markets through the traditional Black Sea routes. This initiative, known as the Black Sea Grain Initiative (BSGI), is responsible for around 40% of Ukraine’s grain exports during the war, with a higher proportion earlier in the war and lower proportion more recently6. This initiative was in effect from July 2022 to July 2023 until Russia removed its participation from the deal. However, these 12 months will prove vital for developing Ukraine’s overland trade capacity and stabilizing prices in the intermediate term until other trade routes could be expanded.
An intuitive approach to the analysis of the headline numbers published from the BSGI and Solidarity Lanes will point to meaningful impacts of each initiative through both price impacts and trade volume. However, it is vital to econometrically prove the statistical significance of these initiatives to evaluate their effectiveness. This paper builds off of prior work by other economists, primarily the initial analysis by Poursina et. al., (2023)7 in the Journal of Agricultural Economics and the analysis of Ukrainian commodities and prices by Nazarkina (2023)8 from the University of Kyiv. The work by Nazarkina focuses on the daily effects on prices of Ukrainian grain during the war, however my analysis will focus on the quantity effects of Ukrainian grain exports to evaluate the effects of the BSGI and Solidarity Lanes in preserving prewar macro trends of Ukrainian and global agricultural exports.
The data used in the economic analysis of this paper comes from FAS endorsed data from Trade Data Monitor,9 and other macroeconomic indicators come from the UN and World Bank10,11. This paper’s aim is twofold. First is to econometrically evaluate the effects of the Russo-Ukrainian war, the Black Sea Grain Initiative, on total global exports of wheat, rice, rapeseed, soybeans, sunflower, and maize. The second is to econometrically evaluate the same effects on particularly Ukrainian exports of the same agricultural commodities. This will be done using a Difference-In-Difference econometric analysis to isolate the effect of the war and the grain deal on specifically Ukrainian exports, and comparing those events’ impacts on global exports as a whole. Following this introduction, I will discuss the methodology, data, results, and concluding remarks.
2. Data and Methodology
2.1 Data Sourcing
The goal of the methodology of this paper is to isolate the effects of the war and BSGI on both total global exports and total Ukrainian exports for a couple of key agricultural commodities, identified by the FAS as significant Ukrainian global exports1. The data for this analysis for both price and quantity of exports globally aggregated and for Ukraine specifically is from Trade Data Monitor (TDM). TDM is a data monitoring service endorsed and used by the USDA’s FAS for tracking international exports between countries. The values sourced from TDM include the globally averaged prices and globally aggregated quantity of exports from January 2012 through September 2023. They also include Ukraine-specific export prices and quantities for the same commodities over the same time period. The exports will be analyzed down to their 4 digit Harmonized System (HS) code level which can be viewed in the following table:
4-digit HS Code | Agricultural Commodity |
1001 | Wheat |
1005 | Corn |
1006 | Rice |
1201 | Soybeans |
1206 | Sunflower |
1514 | Rapeseed |
2.2 Regression Design
Compared to the papers by Poursina et. al., (2023)7 and Nazarkina (2023)8 which use daily prices to analyze the effect of the BSGI and war on global and Ukraine-specific price stability, this paper uses monthly averaged prices and monthly total quantities. This is due to two reasons. First, daily prices are subject to significantly more volatility than monthly averaged prices because daily prices reflect changing global sentiment depending on the news of the day. Significant changes of price from day-to-day cannot be isolated to a single global event and are subject to a variety of forces that change in magnitude fluidly causing more noise in the data. Using average prices for a month provides a more stable picture that can better identify longer term events that take place over the course of months and years. Global monthly exports are being used with the same logic, as events such as weather, bureaucratic delays, and other market and natural forces will affect daily exports causing more noise in the data. While things like weather cannot be predicted day to day, it can be safely averaged month to month to give a more stable trend.
The Difference-in-Difference (DiD) Analysis performed in this paper is completed in Python using multiple statistical packages including: Pandas, statsmodels.api, numpy, and Matplotlib. To perform this DiD analysis, this paper uses the following function to estimate the effects of the grain deal and war on Ukrainian and world exports:
Q =B0+B1(Y*)+B2(W)+B3(D)+B4(U)+B5(P)+B6(W*U)+7B(D*U)+ e
Where:
Q = Quantity of Commodity X (Measured in Tonnes)
Y* = Monthly Global Real GDP (Measured in Current $USD)
W = War Binary Variable
D = BSGI Binary Variable
U = Is-Ukraine Binary Variable
P = Price of Commodity X (Measured in $USD/Tonne)
W*U = War and Is-Ukraine Interaction Term
D*U = BSGI and Is-Ukraine Interaction Term
2.3 Variable Significance
Global Monthly Real GDP (Y*): This variable captures the overall economic activity globally. An increase in global GDP is generally expected to increase the demand for commodities, thereby potentially increasing their quantity (Q). This reflects the economic principle that higher income levels can boost consumption and demand for goods, especially in regards to staple food products like grains and oilseeds.
War Dummy (W): The war dummy represents the presence or absence of war conditions in Ukraine, which can significantly disrupt supply chains and production, thereby affecting the quantity of commodities available for export. War typically reduces commodity quantities due to production disruptions and erected trade barriers as a response to global uncertainty. This variable holds the value of 0 before February 2022 and holds the value of 1 from February 2022 until present.
BSGI Dummy (D): This dummy variable captures the impact of the BSGI on the quantity of specific commodities sold. It is expected that the BSGI will have a positive effect on the quantity demanded and therefore exported globally and by Ukraine. This variable holds the value of 0 from the beginning of the time series until July 2022, holds the value of 1 between July 2022 and July 2023, and once again holds the value of 0 between August and September 2023.
Price of Commodity X (P): The price variable reflects market conditions. In the case of food commodity exports particularly, an increase in price will result in a decrease in total exports due to a nations’ relative preference to use domestic supply over international supply at higher prices. International commodity prices can be functionally considered a price floor that changes as a result of global market conditions. At higher prices, countries will import less causing total traded quantity to decrease, while at lower prices, countries will import more causing total traded quantity to increase.
Is-Ukraine Dummy (U): This variable distinguishes Ukrainian data from global data. The coefficient of this dummy will capture the baseline difference in quantities between Ukraine and the global average, reflecting Ukraine's specific market conditions and production capabilities.
War and Ukraine Interaction (W*U): This term is critical for understanding the unique impact of the war on Ukraine's commodity quantities. It isolates the effect of the war on Ukraine, distinct from its global impact. Theoretically, this interaction could significantly reduce Ukraine's export quantities due to the direct and severe impact of war on its production and export capabilities.
BSGI and Ukraine Interaction (D*U): Similar to the war interaction term, this captures the specific impact of the BSGI on Ukraine. If the BSGI facilitated trade for Ukraine, we expect this term to positively influence Ukraine's export quantities, counteracting some of the war's negative impacts.
2.4 Total Effects
Estimation of the total effects of the BSGI and Russo-Ukrainian War for global and Ukraine-specific exports can be described as the following:
2.4.1 Global Effects:
2.4.1-1 Global effects of war quantity on exports = B2
2.4.1-2 BSGI offset of global war effects = B3
2.4.1-3 Net global war and BSGI effects = B2+B3
2.4.1-4 Estimate of Global Export during war without BSGI at time (t) = B1(Yt)+B2+B5(Pwt)
2.4.1-5 Estimate of Global Export during war with BSGI at time (t)= B0+B1(Yt)+B2+B3+B5(Pwt)
2.4.2 Ukraine-Specific Effects:
2.4.2-1 Effects of war alone on Ukrainian exports = B2+B4+B6
2.4.2-2 Nominal effect of BSGI on Ukrainian exports = B3+B4+B7
2.4.2-3 Net Effect of BSGI on Ukrainian exports = B2+B3+B4+B6+B7
2.4.2-4 Estimate of Ukrainian export without BSGI at time (t)= B1(Yt)+B2+B4+B5(Put)+B6
2.4.2-5 Estimate of Ukrainian export with BSGI at time (t)= B0+B1(Yt)+B2+B3+B4+B5(Put)+B6+B7
2.5 Limitations of Methodology and Data
Imperfect Control Group: Using global exports as a control group for Ukrainian exports is not ideal. The global exports are affected by the same events (war, BSGI) but to a different, but significantly lesser extent. This could lead to biased estimates of the treatment effects due to spillover or general equilibrium effects.
Static Binary Variables: The binary nature of the war and BSGI variables does not capture the intensity or varying impacts over time. The complexity and evolving nature of these events might not be fully represented.
Unobserved Confounders: There could be unobserved variables that influence both the treatment (war, BSGI) and the outcome (export quantities), leading to omitted variable bias. This includes factors like regional political changes, other trade agreements, or market-specific shocks.
Aggregate Data Limitations: Aggregate data masks heterogeneity. Different commodities might react differently to the same events, and within-country variations are also lost in the aggregate data.
Price Elasticity Assumptions: The model assumes a certain behavior of price elasticity which might not hold true uniformly across all commodities and markets. The actual relationship between price and demand might be more complex.
3. Results & Analysis
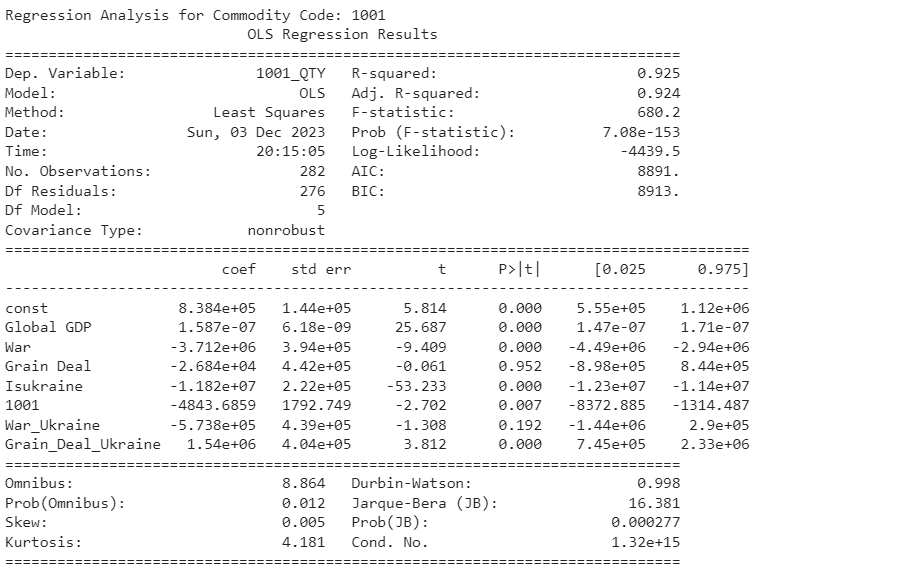
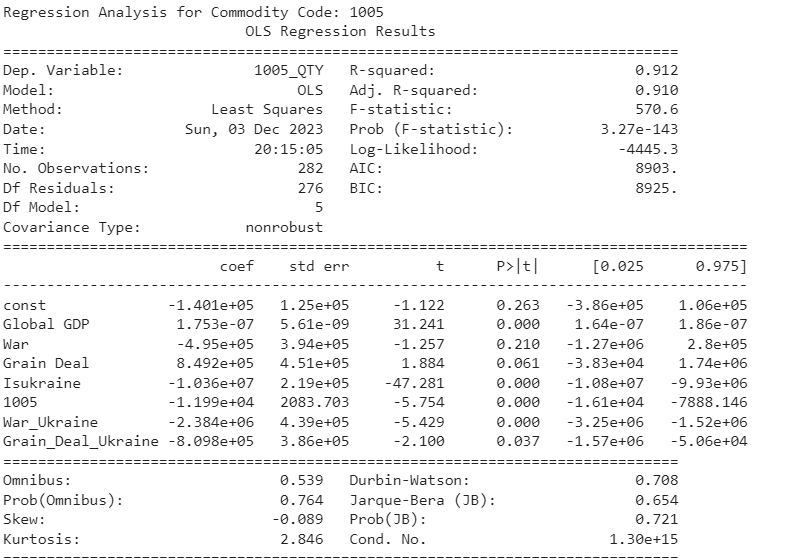
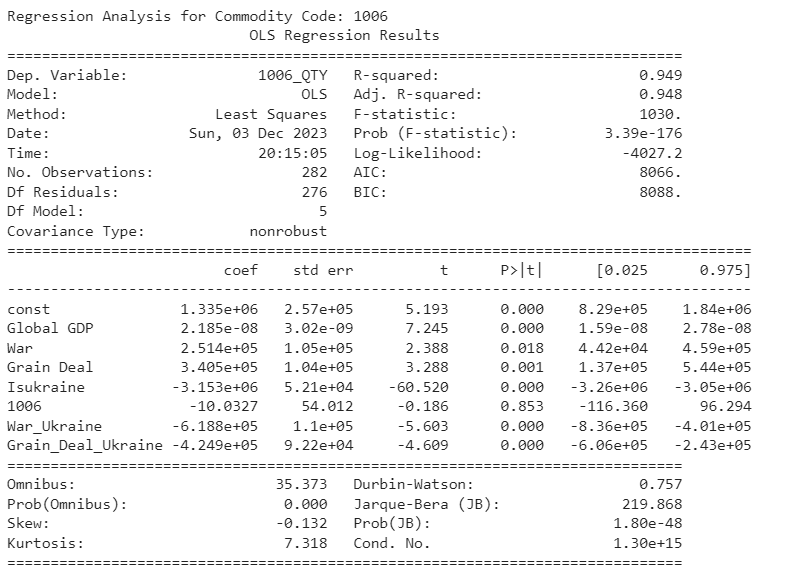
Table 3-1
0 | 1 | 2 | 3 | 4 | 5 | 6 | |
0 | Dependent Variable: Q (Measured in Tons)* | 1001-Wheat | 1005-Corn (Maize) | 1006-Rice | 1201-Soybeans | 1206-Sunflower | 1514-Rapeseed |
1 | Constant | 8.384e+05 (1.44e+05) (T):5.814 | -1.401e+05 (1.25e+05) (T):-1.122 | 1.335e+06 (2.57e+05) (T):5.193 | 2.034e+05 (1.81e+05) (T):-1.125 | -2.65e+04 (7446.197) (T):-3.559 | 1.35e+05 (6.21e+04) (T):2.176 |
2 | Global Monthly Real GDP (Y*) (Current Real $USD) | 1.587e-07 (6.18e-09) (T):25.687 | 1.753e-07 (5.61e-09) (T):31.241 | 2.185e-08 (3.02e-09) (T):7.245 | 1.656e-07 (9.25e-09) (T):17.897 | 2.642e-09 (3.17e-10) (T):8.330 | 3.817e-09 (7.32e-10) (T):5.215 |
3 | War Dummy (W) | -3.712e+06 (3.94e+05) (T):-9.409 | -4.95e+05 (3.94e+05) (T):-1.257 | 2.514e+05 (1.05e+05) (T):2.388 | -7.092e+05 (5.15e+05) (T):-1.376 | 5.594e+04 (2.14e+04) (T):2.614 | -1.101e+05 (2.51e+04) (T):-4.389 |
4 | BSGI Dummy (D) | -2.684e+04 (4.42e+05) (T):-0.061 | 8.492e+05 (4.51e+05) (T):1.884 | 3.405e+05 (1.04e+05) (T):3.288 | 7.243e+05 (5.9e+05) (T):1.228 | 6.58e+04 (2.48e+04) (T):2.648 | -4.06e+04 (2.5e+04) (T):-1.622 |
5 | Price of Commodity X (P) (Current $USD / Tonne) | -1.182e+07 (2.22e+05) (T):-53.233 | -1.036e+07 2.19e+05) (T):-47.281 | -3.153e+06 (5.21e+04) (T):-60.520 | -1.13e+07 (2.92e+05) (T):-38.649 | -1.803e+05 (1.6e+04) (T):-11.236 | -4.409e+05 (1.23e+04) (T):-35.798 |
6 | Is Ukraine Dummy (U) | -4843.6859 (1792.749) (T):-2.702 | -1.199e+04 (2083.703) (T):-5.754 | -10.0327 (54.012) (T):-0.186 | -5081.1703 (1523.219) (T):-3.336 | -7.0305 (22.902) (T):-0.307 | -2.5878 (5.384) (T):-0.481 |
7 | War and Ukraine Interaction (D*U) | -5.738e+05 (4.39e+05) (T):-1.308 | -2.384e+06 (4.39e+05) (T):-5.429 | -6.188e+05 (1.1e+05) (T):-5.603 | -2.473e+06 (5.85e+05) (T):-4.228 | 2922.9416 (2.41e+04) (T):0.121 | 3.146e+04 (2.43e+04) (T):1.295 |
8 | BSGI and Ukraine Interaction (D*U) | 1.54e+06 (4.04e+05) (T):3.812 | -8.098e+05 (3.86e+05) (T):-2.100 | -4.249e+05 (9.22e+04) (T):-4.609 | -8.736e+05 (5.27e+05) (T):-1.658 | 1.391e+04 (2.23e+04) (T):0.625 | 4.708e+04 (2.24e+04) (T):2.103 |
* Regression Performed with monthly data starting in January 2012 through September 2023
Figure 3-1: Commodity Prices Over Time (Current $USD) (World)9

Figure 3-2: Commodity Prices Over Time (Current $USD) (Ukraine)9

Figure 3-3: Commodity Trade Volumes Over Time (Tonnes) (World)9

Figure 3-4: Commodity Trade Volumes Over Time (Tonnes) (Ukraine)9

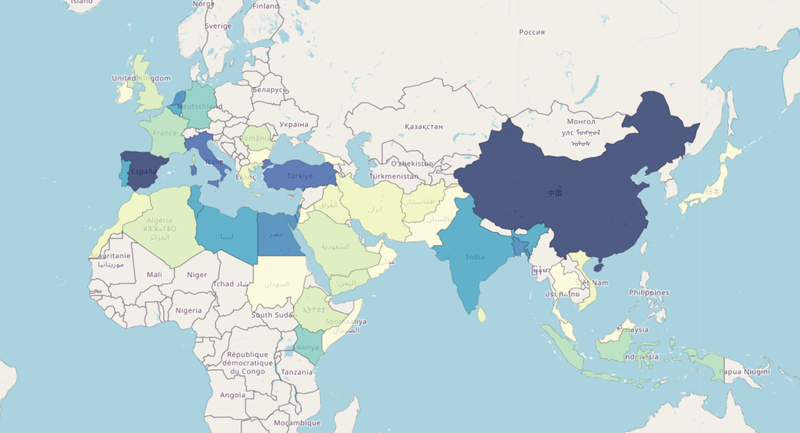
Figure 3-5: Export Destinations of BSGI Shipments11

3.1 Analysis and Discussion
3.1.1 Global Results
To begin this analysis we will be referencing the values displayed in table 3-1, showing the coefficients of each variable, their standard errors, and their t-statistics. Firstly, to discuss the less headlining catching but still importantly significant values, we must look at the effect of global GDP on global export volumes. For all commodities, there is extreme statistical significance in their relationship between total real global output and total quantity of global exports of each of the analyzed commodities. The constant rise in global real GDP over the past decade is a main driving factor for a rise in total quantity exported around the world. The significance of real GDP ranges from a T statistic of 5.2 for rapeseed to a much larger 31.2 for maize. Price is also a massively statistically significant factor in determining export quantities, with a universal relationship of higher prices causing smaller volumes exported. Despite sellers wanting to export more when the global price of commodities is higher, demand is often quite elastic due to the presence of local food substitutes that become relatively less expensive. The T statistic for the effect of price on quantity ranges from -11.2 for sunflower to -60 for rice.
The global impact of the Russia-Ukraine War and subsequent implementation of the BSGI is clearly statistically significant but to varying degrees depending on the commodity and that commodity’s relationship to Ukraine. Ukraine, being one of the primary exporters of wheat by volume in the world, and wheat itself being a necessary staple grain of many diets, had a large negative impact on total wheat exports due to their access to global markets being restricted. Subsequent grain export bans instituted by countries concerned with their own food security due to global instability, primarily India which is the world’s 7th largest grain exporter, and Russia, which exports the plurality of the world’s wheat also contributed to this precipitous decrease. Total wheat quantity fell by an estimated 3.7 million tonnes due to the war singularly with an incredible statistical significance of -9.4.
Substitute goods of primary war-affected commodities like wheat and corn had their market share picked up by rice, another staple grain. A notable exception to India’s grain export ban is their globally popular basmati rice, an even larger staple in many diets across the global south. Rapeseed also saw a statistically significant decrease in quantity exported globally due to the Russo-Ukrainian war, as Ukraine is the world’s 6th largest producer.
The BSGI’s effects in isolation on the world export market is significant for some commodities, but not for others. Large volume increases were seen in rice, which was rising due to its substitute nature and sunflower, of which Ukraine is the world’s 2nd largest producer.
Looking at figures 3-1 and 3-3, there is a massive jump in price for rapeseed and sunflower due to the war which can be clearly seen on the graph. Due to the fewer number of large producers of each of those specific commodities, they had the most pronounced price effects. We can also see a significant downturn in wheat and corn exports at the start of the war with a minor increase in rice that picked up some of the market share. Wheat still has not recovered anywhere close to prewar levels, but maize and soy have recovered significantly.
The global effects on both price and quantity due to the Russo-Ukrainian war are evident in the figures, and the statistical significance is present for some commodities globally, particularly direct substitutes of Ukrainian products or those products themselves.
3.1.2 Ukraine-specific Results
Referring back to table 3-1, row 6 displays the difference between World and Ukrainian exports. All values t statistics are statistically significant to a large degree, which is expected since this variable is simply measuring the gap between Ukrainian and global export quantities. Controlling for global real GDP, and for specific Ukrainian data, we can analyze the Ukraine-specific effect of both the war and BSGI on their exports specifically. The key to this analysis is reviewing the significance of the interaction terms, which are crucial to a DiD regression. The Is-Ukraine and War-and-Is-Ukraine terms have statistically significant negative coefficients for wheat, maize, rice and soybeans, with statistical insignificance for rapeseed and sunflower. This is an intuitive outcome as the start of the war had a direct effect of decreasing exports of staple grains with having insignificance for non-staples like rapeseed and sunflower.
The subsequent BSGI and Ukraine interaction terms shows a significant positive coefficient for wheat and rapeseed, both of which Ukraine ranks among the top 10 exporters in the world. There is negative statistical significance for corn and rice. According to figure 3-4, the export capacity of Ukrainian corn did not take as large of a hit as wheat, and was able to more quickly recover than wheat to an approximate seasonal regularity. Rice is exported in such a small quantity that it can be considered a non-factor due even with its negative statistical significance.
Taking a look at this model as a whole, Ukraine took a significant hit at the start of the war on their export capability, particularly with wheat, corn and soybeans, which account for their largest agricultural exports by volume. This can be seen in the regression results in table 3-1 and in the graph of quantity exported in figure 3-4. There are also significant price effects that are evident in figure 3-2, showing significant spikes in price for rice, rapeseed, maize, soy and wheat. Due to the discrepancy in commodity prices per ton, the magnitude of price effects is not immediately evident in the figure, but graphing each price separately will show increases in prices as a result of the invasion.
4. Concluding Remarks
The Russo-Ukrainian war that began in February 2022 and continues through the writing of this paper in December 2023 has proven to have a significant impact on the international agricultural export market due to its price and quantity effects. The initiatives that have been implemented to preserve Ukraine’s access to international markets for their agricultural commodities have proven significant to varying degrees, though all positively impacted the exported quantity of the studied agricultural commodities globally. As can be seen in figure 3-5, the largest recipients by volume of BSGI shipments according to the UN commission, have been developing countries. Without this negotiated agreement between the announcement and full implementation of the European Solidarity Lanes, many nations across Africa and Asia would find themselves in significant food crises.
The BSGI has been one of the great successes of international cooperation and diplomacy, providing a legal framework to ensure food security for 10s of millions of people around the globe. Further research into this topic should go down a couple of avenues to more deeply study this topic. First, the global distribution of the welfare effects for consumers from the BSGI and Solidarity lanes should be evaluated to determine the largest geographic beneficiaries of the agreement. This will be able to be more thoroughly studied in future months as more data continues to be published by the European Union, UN, and Ukraine itself.
Second, the global distribution of exporting beneficiaries should also be studied. The price effects of the war in Ukraine have proven to be significant, with many substitute goods both increasing in price and in export quantity during the many months of the war. Calculating the welfare additions for the exporting countries which gained international market share should be a goal of research.
Finally, the change of geographic distribution of agricultural production of subsequent seasons after 2022 should be researched. The change in availability for many agricultural commodities around the world provided a market incentive for many farmers to change the mix of crops they grew in subsequent years in order to adjust to the new export equilibrium. A geographic analysis of the changes will show the lasting impact of the war on the world agricultural production market.
5. References (In order of appearance)
1. USDA Foreign Agricultural Service. (2022, April). Ukraine Agricultural Production and Trade. https://fas.usda.gov/sites/default/files/2022-04/Ukraine-Factsheet-April2022.pdf
2. Council of the European Union. (2023, October 23). How the Russian invasion of Ukraine has further aggravated the global food crisis. Consilium.europa.eu. Retrieved December 2, 2023, from https://www.consilium.europa.eu/en/infographics/how-the-russian-invasion-of-ukraine-has-further-aggravated-the-global-food-crisis/
3.Foreign Agricultural Service. (2022, May 19). India: India Bans Wheat Exports Due to Domestic Supply Concerns. USDA Foreign Agricultural Service. Retrieved December 2, 2023, from
https://fas.usda.gov/data/india-india-bans-wheat-exports-due-domestic-supply-concerns
4. Welsh, C., & Center for Strategic and International Studies. (2023, February 24). Russia, Ukraine, and Global Food Security: A One-Year Assessment. CSIS. Retrieved December 2, 2023, from https://www.csis.org/analysis/russia-ukraine-and-global-food-security-one-year-assessment
5. European Commission. (2023, September). EU-Ukraine Solidarity Lanes | European Commission. EU Solidarity with Ukraine. Retrieved December 2, 2023, from https://eu-solidarity-ukraine.ec.europa.eu/eu-assistance-ukraine/eu-ukraine-solidarity-lanes_en
6.United Nations Conference on Trade and Development (UNCTAD). (2022, September 23). The Black Sea Grain Initiative: What it is, and why it's important for the world. unctad. Retrieved December 2, 2023, from https://unctad.org/news/black-sea-grain-initiative-what-it-and-why-its-important-world
7. Poursina, D., Schaefer, K. A., Hillburn, S., & Johnson, T. (2023, May 25). Economic impacts of the Black Sea Grain Initiative. Journal of Agricultural Economics, 8. https://onlinelibrary.wiley.com/doi/full/10.1111/1477-9552.12549
8. Nazarkina, R. (2023, June). MPACT OF THE GRAIN DEAL ON DOMESTIC GRAIN PRICES (O. Nivievskyi, Ed.). https://kse.ua/wp-content/uploads/2023/07/Nazarkina_thesis_pdf.pdf
9.Trade Data Monitor. (2023, 11). Ukrainian Export Figures for 1001, 1005, 1006, 1201, 1206, 1514. Trade Data Monitor: Homepage. Retrieved December 2, 2023, from https://tradedatamonitor.com/
10.World Bank. (2023). GDP (current US$) | Data. World Bank Data. Retrieved December 2, 2023, from https://data.worldbank.org/indicator/NY.GDP.MKTP.CD
11. UN JCC Secretariat (Ed.). (2023, July). Ukraine BSGI Outbound Shipments [Catalog of all BSGI shipments]. UN JCC Secretariat. Retrieved 12 3, 2023, from https://docs.google.com/spreadsheets/d/1vQD_V0AnKWLHzgF0CxQ3EhgpiYdLcbl4AyoP4znvSYI/edit#gid=65151452
6. Appendix
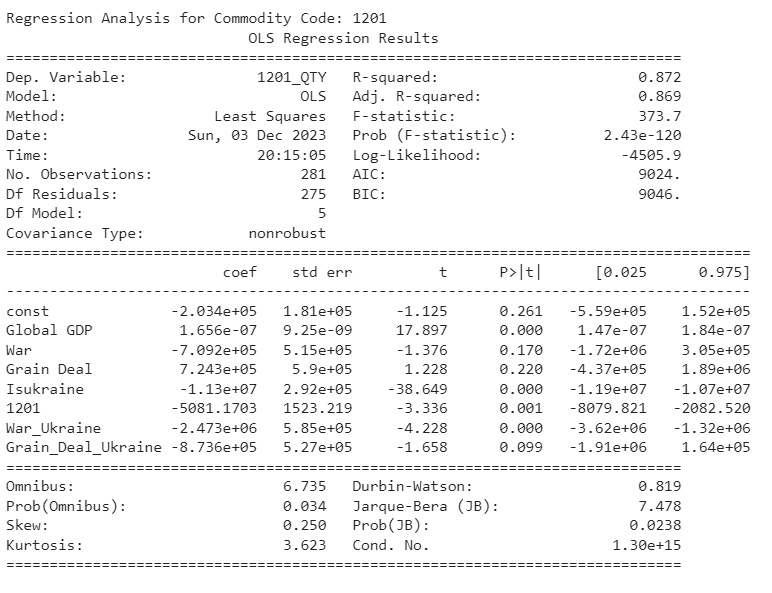
A.1: 1001-Wheat
A.2: 1005-Corn
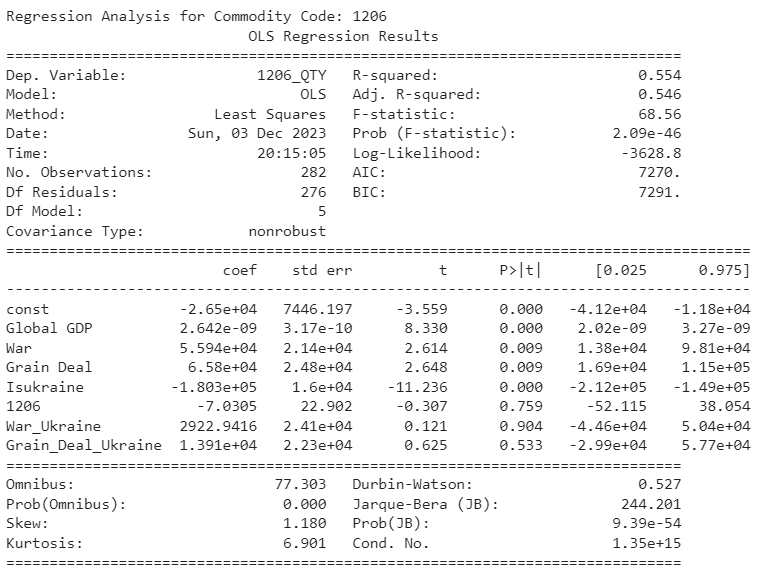
A.3: 1006-Rice
A.4: 1201-Soybeans
A.54: 1206-Sunflower
A.6: 1514-Rapeseed

A.7: Ukraine Commodity Prices (Excluding Rapeseed & Rice for Price Visibility)

A.8 BSGI Shipment Destinations by Geographic Region
A.9 BSGI Shipments by World Bank Income Classification